
The 6-foot-5 Justin Verlander led qualified MLB starting pitchers in strikeout percentage in 2018. (via D. Benjamin Miller)
Mookie Betts, Jose Ramirez and Alex Bregman were three of the top five offensive contributors in 2018. They all accomplished this despite being the size of average human beings.
The top pitchers between 2016 and 2018, however, represent a stark contrast. All seven of the top pitchers over the past three seasons were at least 6-foot-3, with only two of the top 14 (6-foot-2 Aaron Nola and 6-foot-1 Trevor Bauer) shorter than that. Of the top 23, only five are below 6-foot-3, and all are at least 6-foot-1. Marcus Stroman is correct that Height Doesn’t Measure Heart; however, it definitely measures an individual’s potential to be a front-end major league baseball starter, especially in today’s game.
I begin most of my research with a hunch, which I then test with data. In most cases, my hunch is generally on the money, though sometimes it just plain goes nowhere. For today’s piece, the data took a very interesting, unexpected turn.
My hunch was, despite Glenn Greenberg’s research that there was no performance benefit to height, the fact that all the best pitchers were tall had to mean something. My data gut was telling me there was something to the fact that Chris Sale, Max Scherzer, Corey Kluber, Jacob deGrom, Justin Verlander, and Clayton Kershaw were all 6-foot-3 or taller. I nourish my data gut with probiotics, so it’s generally pretty good.
My hunch was mostly correct, in that height does matter; however, what I discovered was that the optimal point appears to be 6-foot-4, with declining returns away from that (in both directions). Further, it appears the benefit of being taller is a recent phenomenon, with taller starters starting to outpace shorter starters. The reason for this is quite interesting, and we’ll explore the data behind it with the helpful aid of some visuals.
Let’s look at some charts.
Swinging Strike% – Starting Pitchers 2008-2015
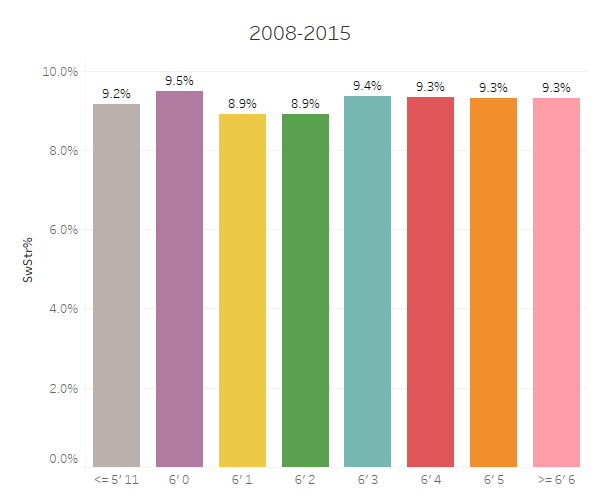
We see a slight disadvantage in SwStr% (Swinging Strike Percentage) for starting pitchers 6-foot-1 or 6-foot-2; however, there doesn’t appear to be any differentiation other than that. I selected SwStr% as the catch-all metric as it works very well as a singular metric to capture value. It is easy to understand what it means (swinging strikes per pitches thrown) and is a pretty good predictor of performance. We could have gone with pitch values, whiff rates or some other metric; however, I’m a big fan of SwStr%, so we’ll be using that to drive most of our analysis today.
Let’s contrast the chart shown above to what the data look like from 2016 through 2018.
Swinging Strike% – Starting Pitchers 2016-2018
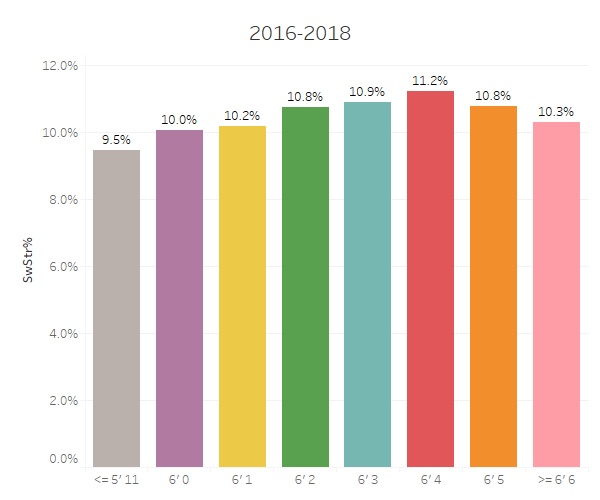
Cool! I figuratively jumped out of my seat when the data popped out this way. Clearly, something significant, at the macro level, is occurring that benefits pitchers 6-foot-4 more than pitchers at any other height. It is important to note that this appears to affect only starting pitchers; relief pitchers aren’t affected by height (yet). Also, we see a markedly different distribution than the previous seasons, with a seeming bell-curve type distribution.
So what’s driving this difference, and why does it benefit taller pitchers more? It appears it boils down to pitch type composition, specifically that there appears to be an optimal height for curveballs and four-seam fastballs, but not for change-ups. Let’s begin with the macro trend of pitch types as a percentage of all pitches, with our two eras compared.
Pitch Type %Usage 2008-2015 vs 2016-2018
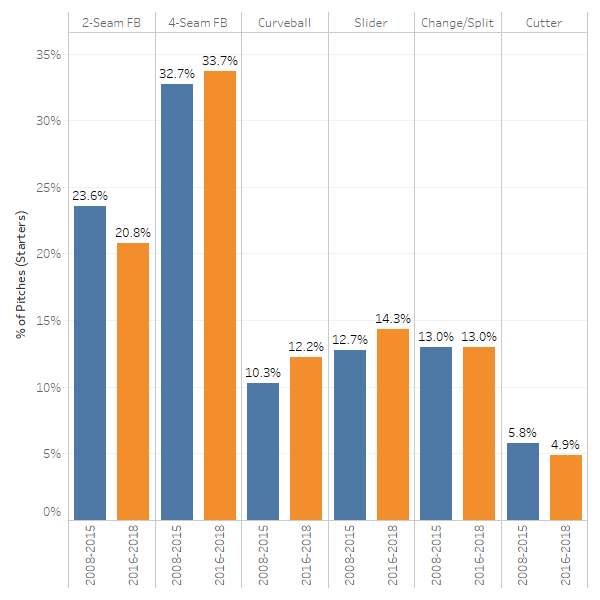
We see a significant decline in two-seam fastballs, offset by a modest increase in four-seam fastballs and large increases in curveballs and sliders. It’s important to note that change-up and splitter usage remained constant. We’ll see why in a moment. Usually, pitch usage changes go hand in hand with other macro trends, so let’s look at how these pitch types changed between the two time periods.
Pitch Type Swinging Strike %, 2008-2015 vs 2016-2018
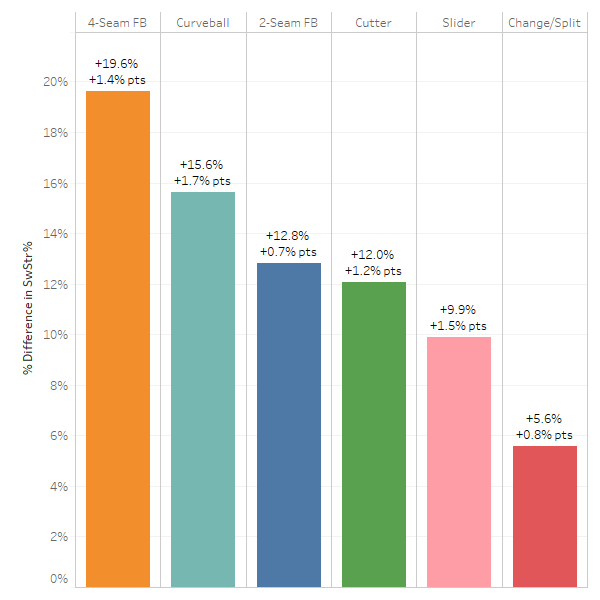
Four-seam fastballs gained the most in terms of SwStr%, increasing 1.4 percentage points, for an almost 20 percent increase in effectiveness. Change-ups, all the way on the other side of the graph, have barely seen any increase. This would appear to answer the question of why change-ups haven’t seen a spike in usage: They simply aren’t making the same SwStr% gains the other pitch types are. Curveballs see a massive percentage point and percentage increase, significantly higher than sliders.
How important is spin to gain swinging strikes? It depends on the pitch type. Before we look at another chart, it is important to note that being taller provides no advantage in terms of the ability to spin the baseball. Below are the spin rates by pitch type and pitcher height:
| Pitcher Height | 2-Seam FB | 4-Seam FB | Change/Split | Curveball | Cutter | Slider |
|---|---|---|---|---|---|---|
| <= 5′ 11 | 2,157 | 2,307 | 1,698 | 2,641 | 2,374 | 2,533 |
| 6′ 0 | 2,117 | 2,250 | 1,741 | 2,468 | 2,419 | 2,321 |
| 6′ 1 | 2,161 | 2,210 | 1,726 | 2,506 | 2,376 | 2,426 |
| 6′ 2 | 2,157 | 2,270 | 1,803 | 2,488 | 2,370 | 2,389 |
| 6′ 3 | 2,113 | 2,271 | 1,698 | 2,478 | 2,269 | 2,380 |
| 6′ 4 | 2,133 | 2,271 | 1,684 | 2,460 | 2,354 | 2,373 |
| 6′ 5 | 2,180 | 2,276 | 1,722 | 2,547 | 2,388 | 2,427 |
| >= 6′ 6 | 2,108 | 2,250 | 1,766 | 2,400 | 2,229 | 2,404 |
| Average | 2,140 | 2,263 | 1,732 | 2,491 | 2,348 | 2,396 |
We see some random fluctuation with curveballs; however, the extremely consistent four-seam fastball numbers paint a very clear picture: Height doesn’t help spin rate. The important take-away is that any advantage taller pitchers have with throwing a curveball is not dependent on spin. With that in mind, let’s look at a some pitch spin metrics.
Spin Importance – Four-Seam Fastballs 2017-2018 (Min Sample Size 1000)

Focus on the the blue and orange lines. A four-seam fastball thrown with low spin (1700 rpm) will get a swing and miss about 11.4 percent of the time, corresponding to a five percent SwStr%. At the top end, around the 2700 rpm mark, we get 30.6 percent and 15.4 percent, respectively. That’s a huge, massive, incredible difference. This explains how simple tweaks to Verlander and Gerrit Cole unlocked their fastballs and saw them each make huge jumps in their four-seam SwStr% rates after they got to Houston. Also of note is how linear the benefit is; for every 100 rpm added to a four-seam fastball, the pitch gains 1.7 percentage points of whiffs.
Let’s put that into context. The average four-seam fastball spins around 2250 rpm. Let’s say this pitcher is using only 80 percent of that spin (the technical term is transverse spin, though it is colloquially called spin efficiency or useful spin; however, I prefer Tom Tango’s “active spin” nomenclature), so that it effectively operates at 1800 rpm. If you can replicate what the Astros did and boost the active spin to 100 percent, you can give that pitch a 7.5 percent point increase in swing and miss. That’s huge. This only scales up with pitchers that already have a superior ability to spin the fastball or had low active spin.
Spin Importance – Curveballs 2017-2018 (Min Sample Size 500)
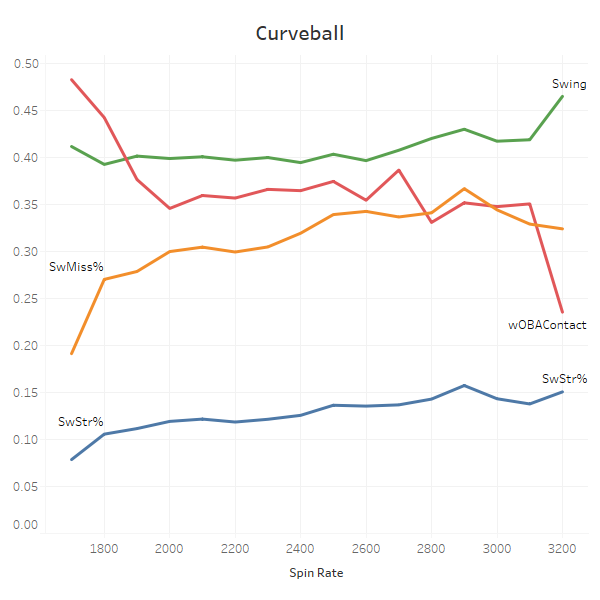
We’re leaving out Swing Rate on this chart as it was visually distracting. Extremely low spin curveballs (below 1900 rpm) are hit a lot harder than higher spin curveballs, which is interesting and a topic for another day. We see a linear trend from about 1700 rpm all the way to 2900 rpm for Swing and Miss% and SwStr%. Above that threshold, it appears the benefit starts to drop off. I don’t have a clear explanation for why this occurs. It could be measurement issues or something to do with tunneling, or it could mean there is a tipping point where there is too much break.
Let’s contrast the above pitches with change-ups and splitters.
Spin Importance – Change-ups and Splitters 2017-2018 (Minimum Sample Size 500)
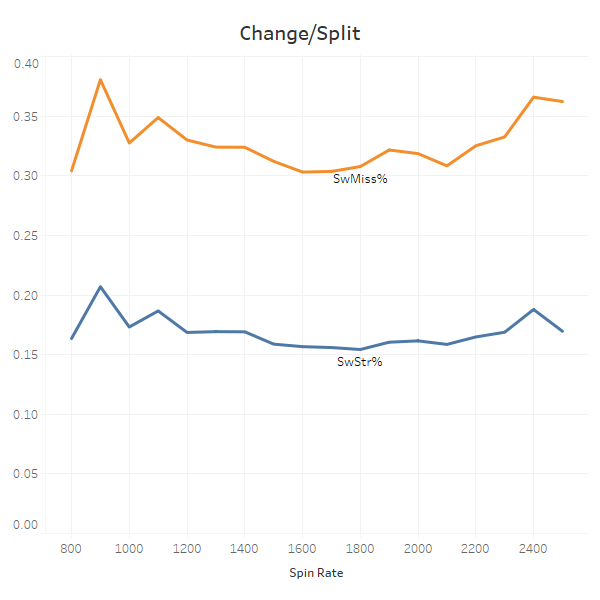
Between 1400 and 2300 rpm, there is virtually no benefit (as measured by SwStr%) to incremental spin. It’s quite possible the higher spin measurements may be running into pitch classification issues, though I can’t comment on this definitively. The important takeaway here is that when a change-up is thrown, the goal is for it to be a low-spin pitch. Lowering that further doesn’t really yield any tangible benefits. Further, being a low spin pitch, reducing the active spin percentage won’t accrue nearly the same benefit as increasing the active spin percentage of a higher-spin pitch.
Circling Back to Pitcher Height
We see quite clearly that pitchers who throw curveballs and four-seam fastballs have more room for growth, either by squeezing out a few more rpm or by increasing the active spin. This helps explain why curveballs and four-seam fastballs have seen the biggest spikes in SwStr% compared to other pitch types. This also sheds some light on what the Astros are doing.
My opinion is that as spin becomes more of a focus for pitchers, hitters will find a way to adjust their swings up or down based on a pitcher’s spin profile. This could then lead to pitchers having multiple spin profiles per pitch, and the never-ending game of adjustments moves on the next, even more fascinating, round. Teams are going to need to be equipped with a deep understanding of these dynamics or risk falling very far behind.
Before we went on this spin tangent, we talked about curveballs being the reason 6-foot-4 pitchers are gaining ground on their rivals. Here’s a picture demonstrating that.
SwStr% by Pitcher Height | 2008-2015 | Curveballs
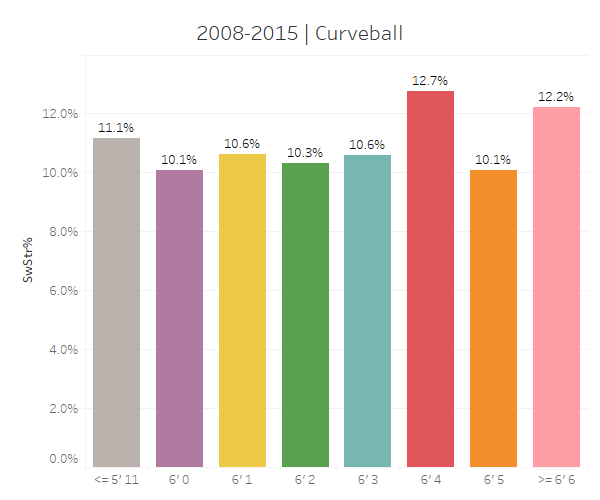
We see from 2008 through 2015, 6-foot-4 pitchers held a persistent advantage, though the distribution was a little random outside that height. Contrast that to 2016 through 2018.
SwStr% by Pitcher Height | 2016-2018 | Curveballs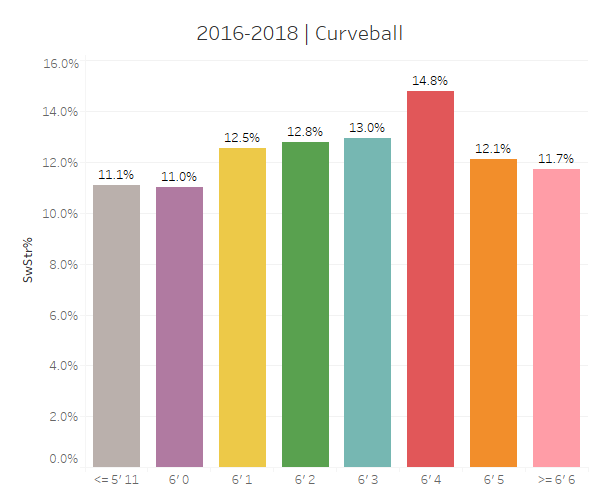
The 5-foot-11 starters gained nothing, while the distribution looks to be more “bell shaped” around a mean of 6-foot-4. My theory, unfounded in any hard data, is that 6-foot-4 is the optimal height to allow for a curveball that breaks just the right amount (better tunneling/pitch masking). If you’re 5-foot-11, even if you could spin a curveball more, more break would just mean you wouldn’t get it in the zone. If you’re too tall, you’ll need too much break and start losing some effectiveness. Again, this is just a wild hunch, but its definitely something to look into.
SwStr% by Pitcher Height | 2008-2015 | Change-ups & Splitters
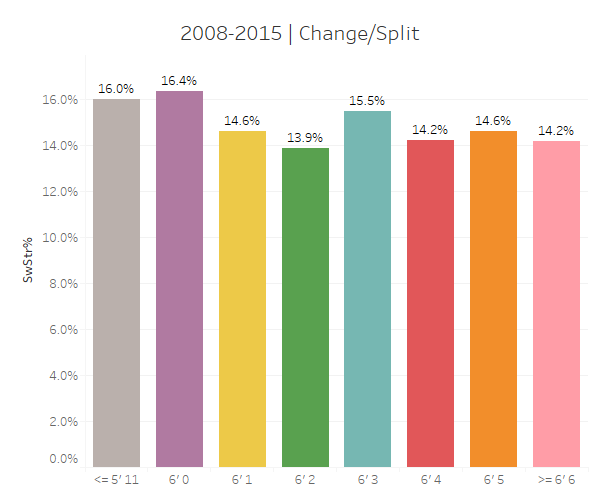
We see a small advantage for really short starters from 2008 through 2015. However, that advantage has somewhat disappeared in the past three years:
SwStr% by Pitcher Height | 2016-2018 | Change-ups & Splitters 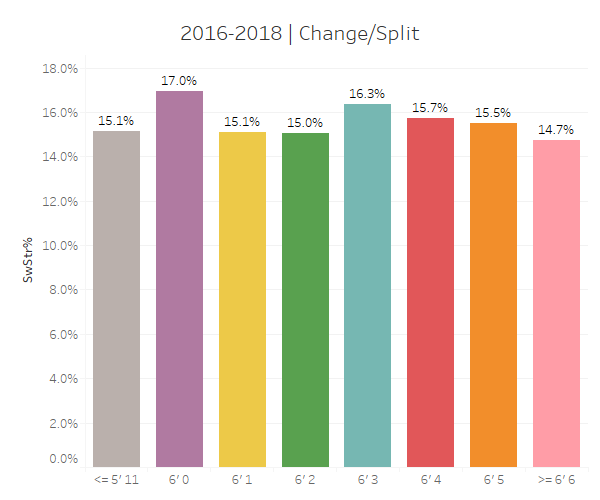
Pitchers under six feet regressed a little; however six-foot starters still have the upper hand. There is probably a fair amount of survivor bias going on here, as there are probably more tall, projectable pitchers with sexy curveballs, as opposed to tall, projectable pitchers with squirrely change-ups. If you’re tall and projectable, you’re more likely to spend more time developing your curveball.
SwStr% by Pitcher Height | 2008-2015 | Four-Seam Fastballs
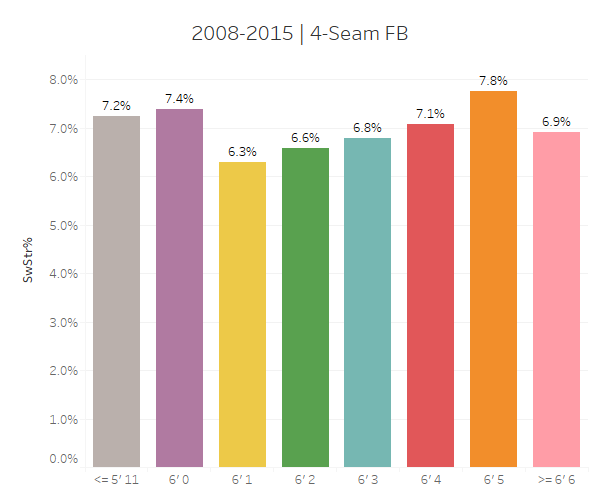
In the long ago past, starters 6-foot and shorter were actually the second most effective group, after 6-foot-5 starters. This is probably due to selection bias, with short pitchers getting noticed only if they have “electric” fastballs.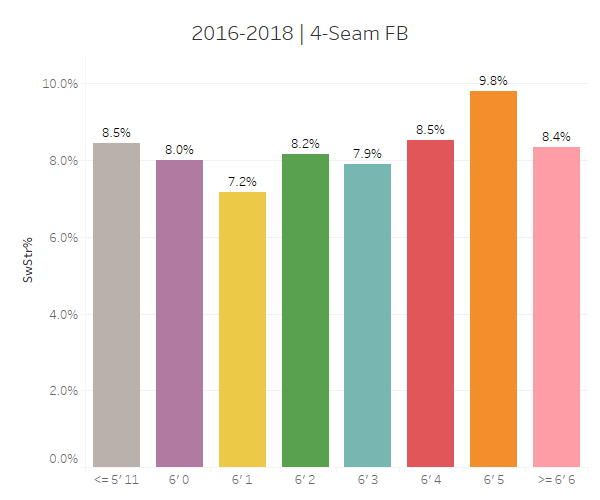
In the modern era, we see an even more pronounced advantage for 6-foot-5 starters, with 6-foot-4 and 6-foot-6 and taller pitchers gaining ground on their shorter colleagues.
Changes in Pitch Usage – Starters 5-foot-11 and Shorter
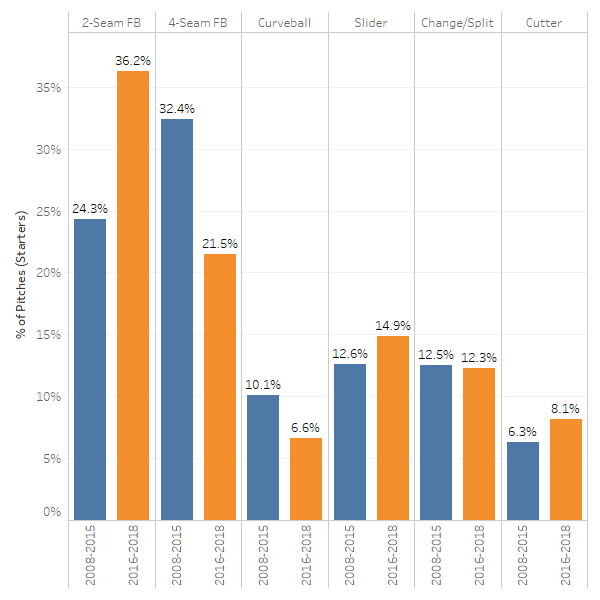
Beware small sample sizes here, as we’re talking about roughly 20-25 starters for the 2016-2018 sample, depending on the pitch type. We see a big increase in two-seam fastballs, mostly at the cost of four-seam fastballs and curveballs. What’s key here is that pitchers under six feet tall aren’t benefiting from curveballs and four-seam fastballs, where we see dramatic gains.
Changes in Pitch Usage – Starters 6-foot-0
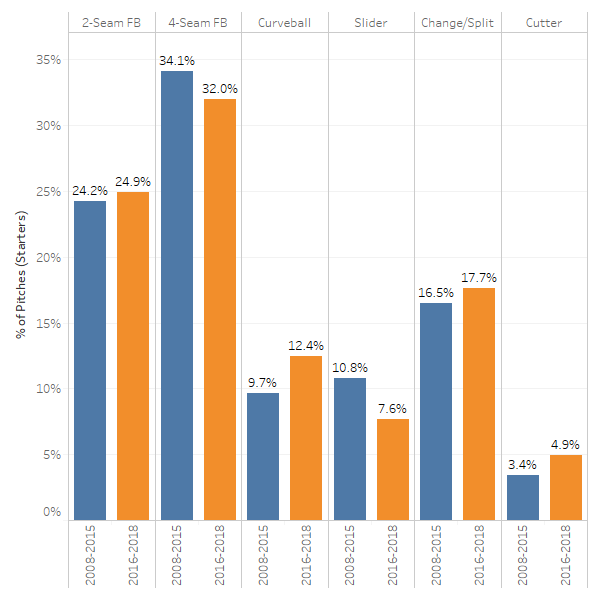
While we see an increase in curveball usage for 6-foot-0 pitchers, this is offset by reduced four-seam and slider usage. The key thing to look at is the increased usage of two-seam fastballs, which is contrary to major league trends. Let’s look at two-seam usage across our various height groups.
Changes in Two-Seam Usage
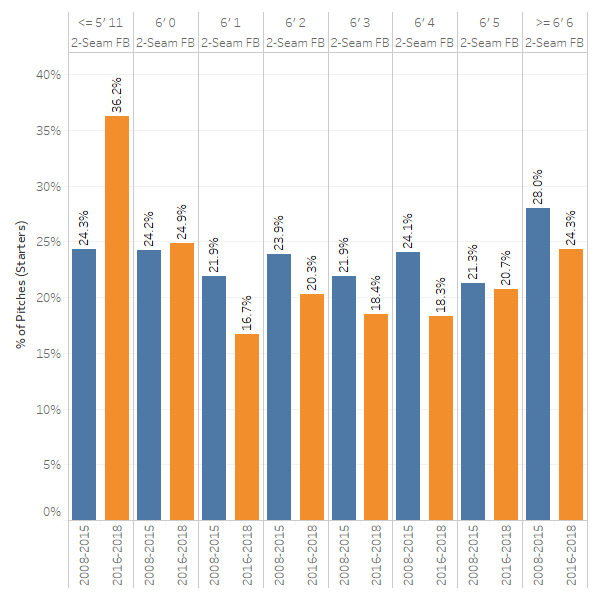
We see every height group, from 6-foot-1 and above, with significant drops in two-seam usage. This might help explain why precisely zero of the top 23 starters are 6-foot-0 or shorter.
Some Lingering Questions
If you’ve been left with more questions than answers, that’s because I don’t really have a good explanation for these phenomena. My hope is someone else will be able to explain why 6-foot-4 appears to be the ideal height for throwing a curveball. Is it just random noise? Is there an optimal vertical break (including gravity and release angle) for a curveball? Should we start crafting pitches based on a pitcher’s height and extension? If there is an optimal vertical break? For really tall pitchers who have more gravity to use, should they now incorporate more horizontal break once they hit the “ideal” vertical break, if it exists?
Concluding Thoughts
The game of baseball is constantly changing and adapting. Advancements in strategy and player development sometimes work to the advantage of certain types of players as opposed to others. The “launch angle revolution” appears to have benefited smaller players more, allowing them to produce meaningful power. The “spin revolution,” on the other hand, appears to be benefiting taller starters more, allowing them to fully use their four-seam fastballs and curveballs.
References and Resources
- Glenn P. Greenberg, SABR, “Does a Pitcher’s Height Matter?”
- Kevin Goldstein, Baseball Prospectus, “Future Shock: Does Size Matter?“
- Alan Nathan, The Hardball Times, “Pitch Movement, Spin Efficiency, and All That“
- Alan Nathan, “Determining the 3D Spin Axis from Statcast Data (updated, March 31, 2015 and August 31, 2018)“
- Tom Tango, Tangotiger Blog, “Statcast Lab: Active Spin Percentage”
- Eric Longenhagen and Kiley McDaniel, FanGraphs, “Top 39 Prospects: Houston Astros“
- Jeff Long, Harry Pavlidis, and Martin Alonso, Baseball Prospectus, “Prospectus Feature: Updating Pitch Tunnels”


